Jeff wrote:

Here's the results.  I expect that you are well aware of these
relationships.
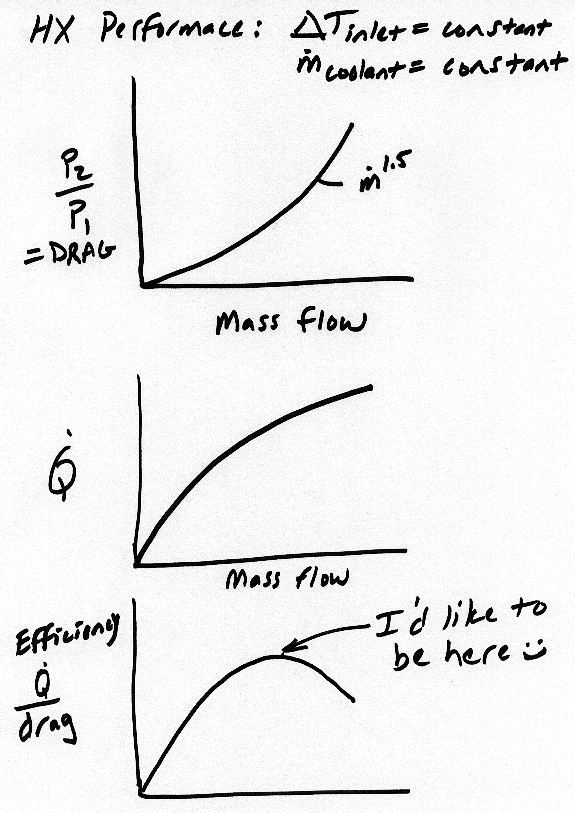
The pressure drop across a radiator core (air side) will usually follow
about
a 1.5 power relationship. (A mix of laminar and turbulent losses) The
real
question is the second graph which shows the rapidly increasing but
leveling
off Q (heat flow) vs. air flow.

The bottom one is what we are all after.  The
peak efficiency for a given core in terms of drag vs. heat transfer is
desired.  The actual value of the peak can also be compared for
different HX
with same inlet conditions.  Actually this peak is multidimensional
because
temperature difference and hot side flow also play a part.  In our case
(for
one engine) these numbers are pretty much fixed so we can test as such.
The
only reason to vary the flow of the hot coolant would be to make sure
were not
way off on the hot side.

 If you look at the second graph, we should be on the
"level" upper part of the Q vs. flow on the hot side.  If we find that
we are
actually on a steep part then that would explain poor performance
overall.
Also note that the rig may have to adapt to single or dual (like tracy)
scenarios so the coolant flow may be half.  As for me, I expect to find
an
approximately 3" thick solution (for higher pressure drop than autos)
that is
efficient.  If the condensors that tracy is using are effective in your
cartop
tests then they would be O.K. for me.

I think that they are probably not very
good.  My options would be a custom job or a stacked arrangement.  I
actually
think 4 units would work for me (because my space is bilateral) and I
think
that a double stack of aluminum motorcycle radiators would be good.  We
tested
some at Moller and found very good performance and they are all alum
with
brazed end tanks.

I would run hot water in second radiator then cooler water
through the front for a true two pass counterflow arrangement.  This
could be
very compact and efficient.  BTW, even though I am not an advocate for
the P51
scoop for everyone I do agree with you that cooling drag is a big
variable in
homebuilding that greatly effects performance.  I think most people
would
really benfit from this type of raw science testing.  I think we have a
chance
to do some real good here for ourselves and our peers.

P.S. I just noticed an error on my charts.  First one should be P2-P1
not
P2/P1.

I just noticed another misleading thing on my charts.  Drag is actually
mass
flow *times* pressure drop.  Therfore the function of drag is more like
mass
flow to the 2.5 power rather than 1.5 as the chart suggests.  All the
more
reason to really know how much flow you want!!!


Jeff

Jeffs-rad-test-chart.jpg

The Aircraft Rotary Engine Newsletter.              Powered by Linux.

http://home.earthlink.net/~rotaryeng/            http://www.linux.org