Perry Mick wrote:
Mike Wills wrote:
 Considering these statistics I would be far more concerned about flying
behind a Ross drive than flying with a plugs up engine.
Well, on this note, let's talk about ducted fans again.

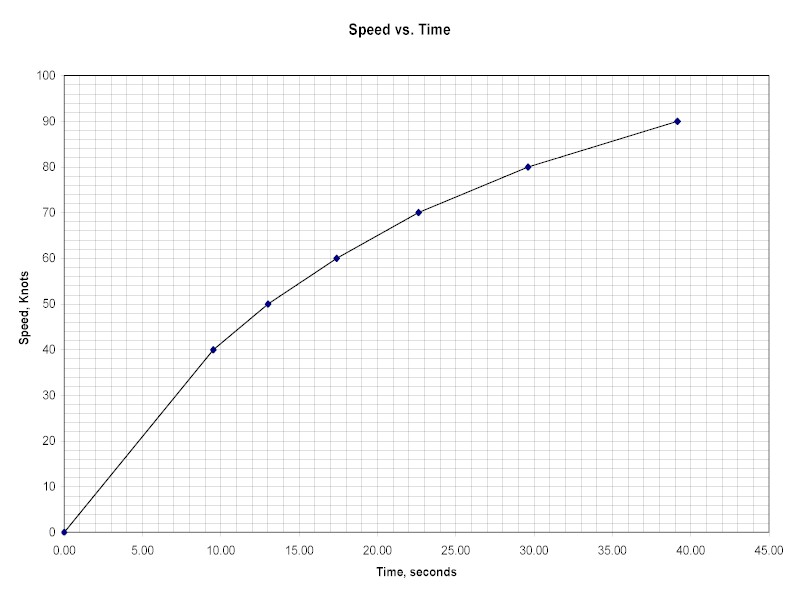
I got some acceleration data this morning, tried to interpret it
by deriving time and distance from velocity and acceleration.  I
could probably get better results just writing down indicated
airspeed vs. time with a stopwatch, and deriving distance from that.
All of this data is rather un-accurate, since the gmeter and the
ASI are fluctuating and I'm trying to get "snapshots" as things are
continuously changing.

I'm a bit sceptical that I'm really using 3800 ft. of runway to get
to 90 knots, since I've never had to brake that hard to stop before
the end of the runway (never really pushed it).  The accelerometer
shows I am still accelerating at 90 knots (revving up those little
wheels).  Also shows that it takes about 1500 ft. of runway to get
to 70 knots.

Paul, please note that my prop running at 4400 rpm is operating
in the 100-110 hp range, not the 180 hp you mentioned in an earlier
post.  The 1986 NA engine is rated at 146hp at 6500 rpm.

With my six-blade prop static rpm was around 3300 I think,
way to low.  I would rather be operating around 5000 or more for
takeoff, so maybe I really need a two-blade prop.

Or add a turbocharger.

It would be interesting if we could get Bill Freeman to take
similar data in his O-235 Long-Ez.  I know his weighs less than
mine, but he could get to 1350 gross by taking the data with a
passenger on board.  Until I can get the horsepower higher than
110hp, I'm only going to get O-235 type performance.

Here's the data, let's see what you can interpret from it:

=============================================
raw data:

airplane gross weight:  1350 lbs.
approximate hp at 4400 rpm:  110

Column 1: velocity in knots, from ASI
Column 2: acceleration in G, from Gtech meter
Column 3: engine rpm

1       2       3
--------------------
0       0.27    4150
40      0.17
50      0.13
60      0.11
70      0.09    4300
80      0.06    4400
90      0.05

=============================================

data interpretation:

Column 1: velocity in ft/sec
Column 2: acceleration in ft/sec^2
Column 3: delta-t = delta-v / average a, seconds
Column 4: t, seconds
Column 5: d, area under velocity vs. time plot, feet

1       2       3       4       5
------------------------------------
0       8.7     0       0       0
67.5    5.5     9.5     9.5     322
84.4    4.2     3.5     13.0    587
101.3   3.5     4.4     17.4    993
118.2   2.9     5.2     22.6    1568
135.0   1.9     7.0     29.6    2452
151.9   1.6     9.5     39.2    3820

=============================================

--
Perry Mick
Duckt N7XR
http://www.mickaircraft.com/duckt.htm
It looks OK Perry. I think it will fly. The speed is still
building at 90 MPH.But hold off awhile longer.
I will have more time to work on it next week when I come  back
from the MO-GIG flyin. Perhaps you could ship that G anlyst to
Bill and see what he gets.

I think you would get more accurate data with a stop watch
and distance markers.

Is this with or without the duct?

Perry-Mick-speed-v-time.jpg

Paul Lamar

The Aircraft Rotary Engine Newsletter.              Powered by Linux.

http://home.earthlink.net/~rotaryeng/            http://www.linux.org