The center range of automotive O2 sensors is useful
for only one thing - minimizing EPA defined emissions. Contrary
to popular
belief, this does not give best power or best fuel economy. At
takeoff
setting on the EC2 (best power) the mixture is near the top of
the scale.
At best economy setting (cruise flight) The O2 mixture monitor
is off the
bottom of the scale.

Tracy Crook
tcrook@rotaryaviation.com
www.rotaryaviation.com
Tracy,

  Is this a limitation of the dynamic range of the O2 sensor itself
or is
the limitation imposed by the monitor that receives its input from
the O2
sensor? If its the latter, seems to me it would be worthwhile to
design and
build a better monitor to take full advantage of the full dynamic
range of
the O2 sensor.

Mike Wills
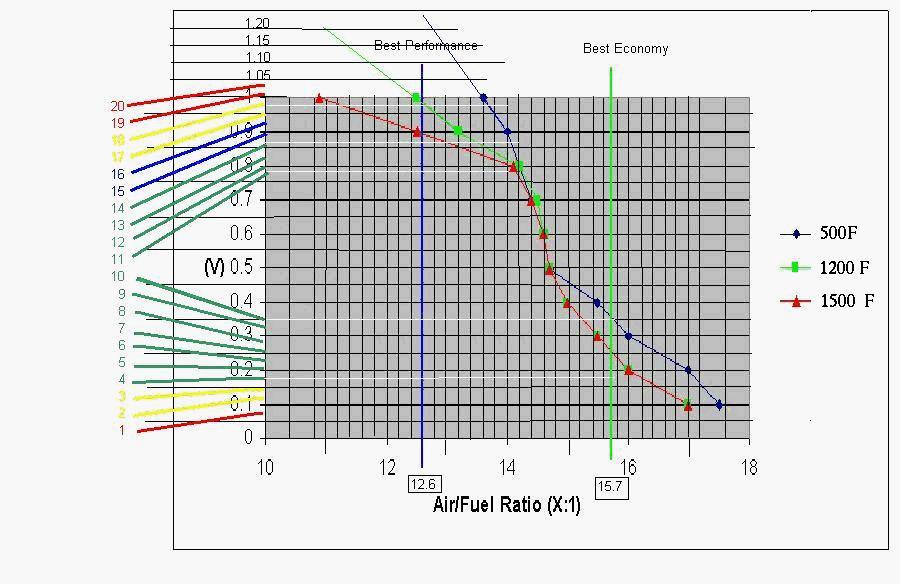
Here is a curve on the O2 sensor  response done by Ed.

Paul Lamar
I am keenly interested in this.  What are the 3 lines on the graph?  And
to what do the 4 colors on the left correspond?  Were the 12.6 and 15.7
values determined empirically, and if not, upon what are they based?
Why isn't the "magic" 14.7, touted as the optimum fuel/air ratio,
represented as "best overall?"

Thanks,
AI Nut
Hi Al,

    The three curves represent the fact that as the temperature of the
sensor changes due to the exhaust gas so does its response curve.  The blue
line is for 500 F, Green for 1200F and Red for 1500F, note that as the
temperature rises the two tails of the curve tend to flatten out.  So that
sensor output of 0.9 volts at 500F represents an Air Fuel of 14:1, that same
0.9 volt output at 1500F represents an Air Fuel of 12.6:1.

AF of 12.6 is a commonly accepted one for best power and 15.7 best cruise. I
got that off of some auto tuning chart.   The magic 14.7 is only best for
emission control purposes.  Keep in mind these are only inferences as to the
Air Fuel mixture.  At 14.7 there is presumably some excess oxygen available
otherwise  enriching the fuel mixture beyond that point would produce no
increase in power. Too much fuel, of course, can cool the combustion gases
and result in even less power.

The four colors corresponded to different color LEDs that I used to indicate
where on the curve the sensor output voltage was thereby an inference to the
AF.  I used 20 LEDs in my first circuit trying to get a more precise
reading.  But, as Tracy has inferred there is really only two conditions I
am really interested in (for aircraft use) and that is the Air Fuel ratio for
best power (for take off) and that for best cruise, its nice having the
others as they indicate a trend when you twist the mixutre knob.  But, you
could really get by just fine (in aircraft use perhaps not for a drag racer
where tenths of a second count) with just three LED one for best power, one
the magical 14.7 just for reference and one for best cruise. IMHO.

Ed Anderson
I added a bit to Ed's illustration to clarify some of these points.

I might add best power mixture and best cruise mixture are functions of altitude.

Every now and then we have people dying when they try unsuccessfully to takeoff
from a 7000 foot strip we have at Big Bear out here in So Cal. They fail to
set mixture for best power at what ever the density altitude is at that time.

You do this by running the engine at full throttle while holding the brakes
and set the mixture for max static RPM. This is particularly important when
taking off at full gross weight. One could build one of Ed's devices
with the twenty LED's and mark it for best power and best cruise at
different altitudes.

Paul Lamar

The AirCraft Rotary Engine NewsLetter.              Powered by Linux.
ACRE NL web site.
http://home.earthlink.net/~rotaryeng/            http://www.linux.org