Dan Ruggirello wrote:

Paul,
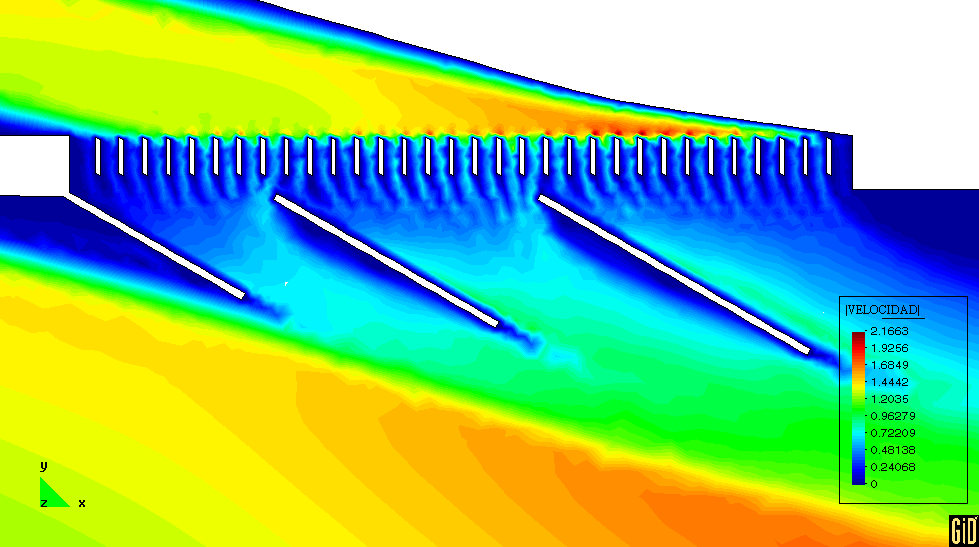
Profile R5 is what I ran last night.  I doubled the radiator vanes and I
thought I had an open
area of 1/3 but after I ran the model I rechecked it and found that I
mistakenly made it 25%. I
found that according to the Stewart website
(http://www.stewartcomponents.com/html/tech_support/advanced_cooling_system_
basics.asp) radiators
have typically 1/3 open area. Not sure if this is true for all
radiators? This model took about
5.5 hours to run and has ~41k nodes.

R6 is the profile you sent to run.  The velocities through the duct seem
greater than previous
runs, perhaps due to a relatively large open area (89% open area). In
general it looks like
modifying the top of the wedge with a slight downward curve as you did
seems to push the velocity
distribution towards the left. This model took about 1.2 hours to run
and has ~25k nodes.
What do you think about an enclosed exhaust vent with the cowl flaps
inside? It may help keep the
exhaust stream closer to the plane thereby reducing drag.

Dan
25% is the bottom limit I would guess. 33% might be slightly higher drag.
I think it is a good idea but hard to implement with a liquid cooling
system.
One could also put a butterfly valve in the intake.

IMHO there is something a bit wrong on the velocity data. How can the
velocity
in the duct in front of the rad be much much higher than the velocity just
on the other side of the rad. V4_R6c looks more like pressure data.
Velocity through the rad should be a function of the pressure difference
across it.
Paul Lamar
Here is my thought on this.  The wedge seems to act as a diffuser and a
venturi.  As the flow aproaches the wedge vertex, it must accelarate since
the vertex is farther away.  This also corresponds to the lower pressure the
closer you get to the wedge vertex.  The wedge also expands the flow out as
a diffuser, the closer you get to turning into the radiator vanes.  Through
the vanes, the average velocity should be lower than the average velocity of
the duct near the inlet (wherever the velocity in most uniform) since the
radiator open area is greater than the duct cross-sectional area.  (In this
case, you have 89% open area, so 16*.89= 14.2 inches  vs 4 inches. )
Immedately after the radiator, the flow expands further, reducing the
velocity even more until the flow begins to recombine downstream.

Dan
Indeed the wedge is acting as a diffuser. The avg. velocity of the air going
in the scoop is reduced by the ratio of rad area over scoop area at the face
of the rad.

The mass (weight) of air per minute  going in the duct must equal the mass (weight)
of air per minute coming out of the rad as we are not adding heat in this
simulation. If we pressurize air we increase the density or weight per unit volume.
The pressure is higher on the the front face of the rad than it is over the rear
face of the rad. Therefor the average velocity of the air over the front face of
the rad must be lower than the average velocity of the air coming out the back
side of the rad. This is why I think the illustrations are mislabeled. Or it
is one over these velocity numbers.

Vance what do you think about this?

Paul Lamar

The AirCraft Rotary Engine NewsLetter.  Powered by Linux.
ACRE NL web site. http://home.earthlink.net/~rotaryeng/
Copyright 1998-2002 All world wide rights reserved.