The cooling of an engine used in an aircraft application is critical to the safety of the operation of the aircraft. If overheating occurs during flight, the operator may have insufficient time to get to a safe landing area.
During many discussions on e-mail newsletters, one factor became apparent, namely that the actual flow that the water pumps that were being installed in aircraft could generate was not known. Because of this lack of data, much speculation has reigned on what was the best pump, and how it should be configured.
Background
I am installing a normally aspirated Mazda 13-B in my KIS Cruiser, a four place, low wing composite aircraft that had a Lycoming 0-360 in the prototype. From data that I have been able to obtain, it appears that the normally aspirated engine will generate equivalent horsepower to the Lycoming. The difference is that the Mazda is water cooled, as opposed to the air-cooled Lycoming. Therefore I need to have an adequate cooling system, and also need to have background information that will let me diagnose any cooling problems correctly. Knowing the flow characteristics of the water pump on my engine is part of the information that I need in order to properly interpret any cooling problems that might arise during engine and flight tests.
Test setup
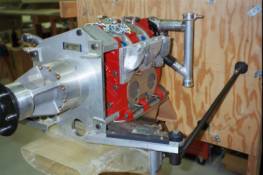
I am interested in the performance of the pump in a configuration that is as representative of my installation as possible. Therefore the pump was tested installed on the engine, with the waterpump modified to give clearance for the cowling and interface to the planned plumbing on the engine.

These modifications consisted of removing the thermostat, cutting off the jportion of the water-pump housing that projected above the cowling, and having a horizontal outlet tubing welded into place. The inlet to the pump had a ?Y? section welded into place to interface with the return plumbing.

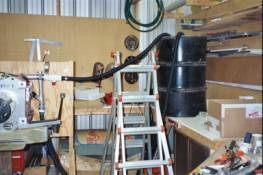
The water source for the pump tests was a 55 gallon barrel set on a work bench. It was necessary to have the water level in the barrel be above the pump in order to keep the pump properly primed between runs. Water was pulled out of the barrel by the pump, flowed through the block of the 13-B, and then back to the barrel. A valve was installed on the pump outlet, in order to vary the flow rate. A pressure guage was installed at the inlet and the exit of the water pump so that I could measure the pressure during operation.

I used an electric motor from my table saw and a long V belt to drive the pump. By varying the pully size on the motor, I could take data at several different RPM, simulating the fact that the pump speed would vary with engine RPM.
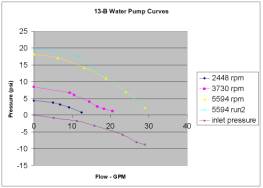
The data was taken by the old-fashioned bucket and stopwatch method. The flow was stabilized, and then the flow was diverted to a bucket and the stopwatch was started. To eliminate as much as possible any effects due to head changes as the pump transferred water from the barrel to the bucket, the bucket was floated on the water in the barrel, and allowed to sink as it filled. Therefore there was no effective change in the head that the pump faced. The raw data, after being converted to PSI vs flow in GPM are shown in the next chart.

You can see some variation from a smooth curve due to the vagaries of taking data by this technique. You can see that the pump inlet pressure goes negative, due to the pressure drop in the hoses leading from the barrel to the pump. In an aircraft installation, that hose will be much shorter, and therefore the pressure available to drive fluid through the radiator cores is the difference between the pump curve data and the inlet pressure data. To make the data more useful, I did a curve fit of the data and replotted it as shown below.
I plotted the data from above on a pressure as a function of (flow-rate)^2, since the pressure drop in general is linear with the square of the flow rate. This allowed me to make a ?best fit? of the data, and to generate an equation for the pump curves. I also could combine the equations to allow for the negative pressure in the inlet line due to the long (and corrugated!) hose. The data analysis chart is shown below.

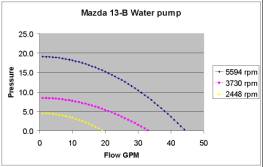
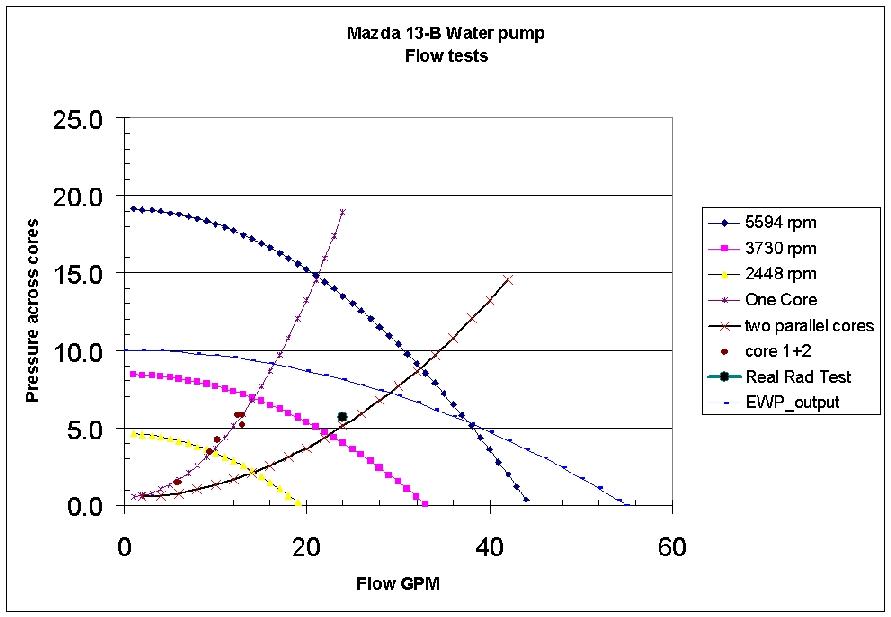
This then allowed me to make a chart showing the pump curves as a function of flow rate, as a smooth curve as shown below.

The next piece of missing information is how much pressure drop is experience across the radiator core(s). My current plan is to follow in the path of Tracy Crook and Ed Anderson who used evaporator cores to cool their engines. Others are using a single large radiator located under the engine, this is a concept that has much merit, but I have not done any pressure drop testing on this combination.
My initial tests of the evaporator cores was done using tap water from the sink, measuring the pressure drop as a function of the flow rate. This gave me some data that allowed me to put it on the same chart as the pump curves. The pressure drop across the core(s) must be supplied by the pump, to the operational point will be where the two curves cross.

The water source I had could not effectively supply enough water for two cores in parallel, which is what I had designed for my system. So the data is shown for a single core (multiple runs), and the curve fit data shows the operational curve for a single core. To get the expected performance for two cores in parallel, I could calculate the curve, since the flow would be twice as much at any given pressure. This is shown on the figure above.
Calculated curves are fine, but I also desired to see if I could measure the flow through the cores with the pump doing the water supply.
My configuration of the evaporator cores is to have them in parallel as shown in the photo below.


The heavy point labeled ?Real Rad Test? is the result of testing done with the evaporator cores in the system. The fact that it lies close to the calculated curve leads me to feel that I can trust these curves in the analysis of my system as I proceed.
I recently obtained a little bit of manufacturers data for the performance of an Electric Water Pump. This unit is made by Meziere, and is stated to deliver 55 gallons per minute maximum flow. A further data point from the company rep indicated that at zero flow, the maximum pressure would be 10 psi. Using the fact that pressure drop is a quadratic function of the flow rate, I have superimposed the EWP curve on the data that I measured. One important difference must be observed in viewing that curve. The EWP is not pumping through the engine block, whereas the measured curves for the 13-B do have that pressure drop. Based on that data, I do not believe that it generates enough pressure to operate the system that I am installing.