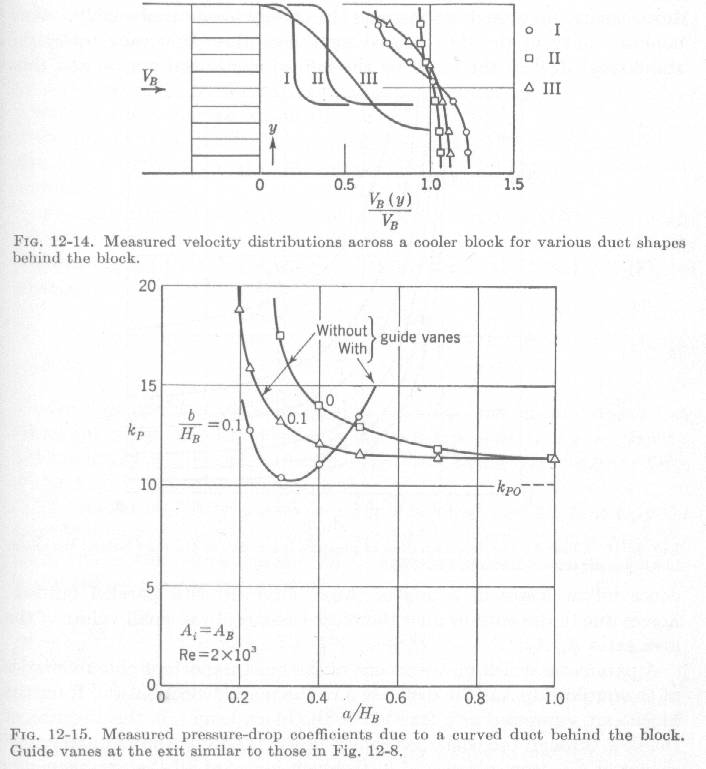
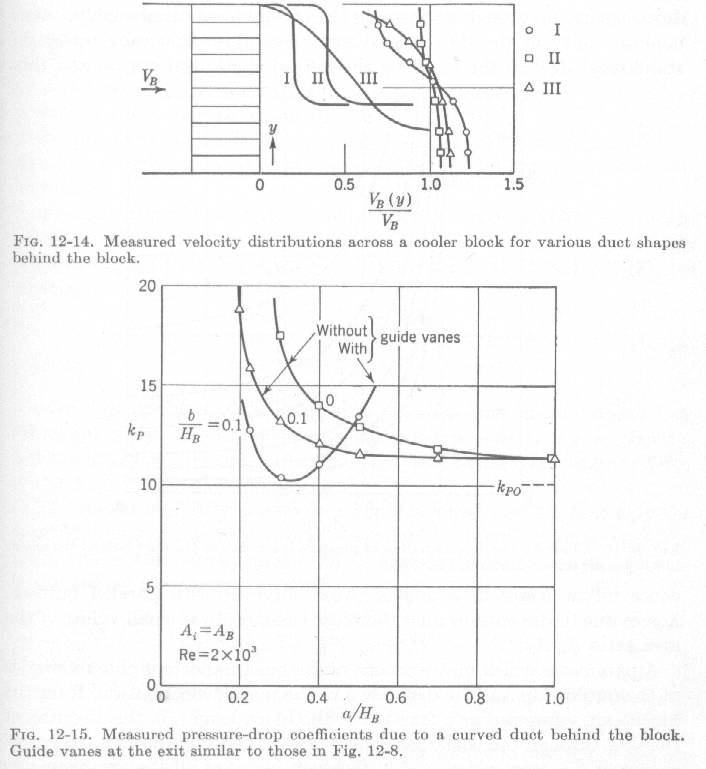
This very interesting chart requires some explanation as many people are still
making the mistake of placing radiators too close to other objects
reducing the air velocity (and thereby reducing the cooling) through
the radiator.

Delta k sub p is the over all pressure loss in the system which translates
directly to air velocity loss all other things being equal.
High velocity loss means more aerodynamic cooling drag. Low velocity
loss less aerodynamic cooling drag.

A sub i is the cross sectional area of the inlet duct opening.
A sub B is the cross sectional area of the outlet duct opening.

The ratio of these two numbers is shown on the horizontal axis of
the chart and is given in numbers less than one. In other words if
the outlet area is twice the inlet area the ratio is .5. Outlet areas
higher than twice the inlet area result in much more drag. This is
why closing your cowl flaps reduces the drag IF the exit area is more than
twice the inlet area. On number from .5 to 1.0 drag is hardly affected.
In other words if the outlet area is equal to the inlet area
the number is 1.0 and the drag is minimized. This is what is so confusing
people when they say "I closed the flap and there was no change".

You need to run the numbers here and calculate both inlet area and outlet
area to figure out what is really going on. If the outlet area is
much less than the inlet area I expect the overall flow through
the rad system is reduced by the phenomena of external diffusion.
In other words air is spilled around the scoop opening and cooling
is reduced. If the flap is completely sealed air cannot get through
at all. No cooling effect either. This effect is NOT SHOWN in this
graph.

Now on the the effect of panels too close to the back of the rad.
a is the distance to the obstruction from the back side of the rad.
H sub B is the height or width of the rad assuming it is a square
shape.

As this "a" distance decreases pressure losses increase also
decreasing the flow through the rad and reducing the cooling effect.
If a is less than .5 times the dimension of the rad the pressure
loss rapidly goes up. If the rad is twenty inches square "a" must be
greater than ten inches or air velocity and cooling effect will
be reduced.

What this chart does not show is the secondary effect of the temperature
added to the air increasing the volume at a given pressure.
So this chart probably underestimates the effect of the panel
proximity and over estimates the velocity loss due to opening
the cowl flaps. Assuming of course the exit area is at least
equal to the inlet area.

Here is another Chart from Horner's book Fluid Dynamic Drag
showing the secondary effect of heating the air on cooling drag.

Paul Lamar
This chart is also very interesting as the exit duct shapes are drawn
to scale. Also air velocity ratios are shown directly.
Duct III is very intuitive. Duct III is similar to Dave Leonard's
bottom duct but better aft of the center of the rad. For the first half
up to half the air velocity is lost in the rad and hence cooling effect.
On the other hand who would have guessed that non intuitive Duct II is
better in all regards. Duct II also appears to meet the 50%
distance requirement throughout the length of the rad.

What this graph does not show is how the flow is reduced because of
the obstruction. The first graph discussed above does that. All it says is
these are the relative velocities.

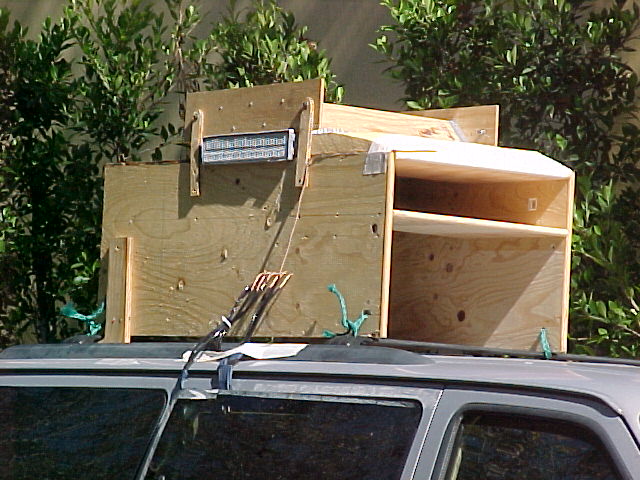
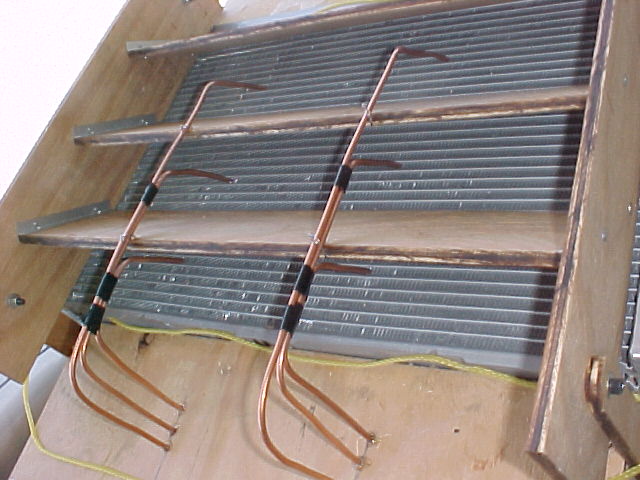
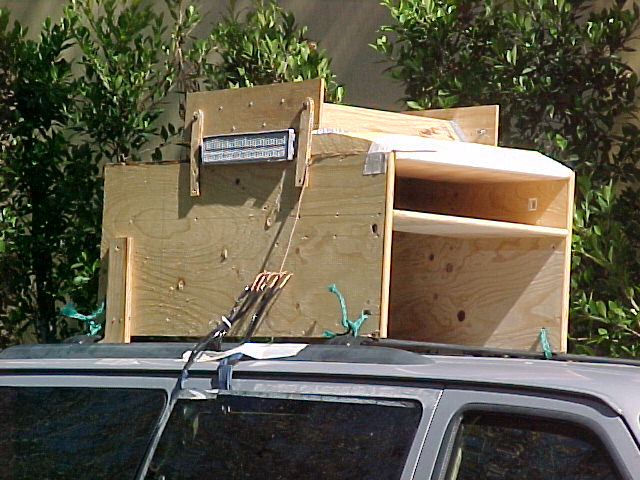
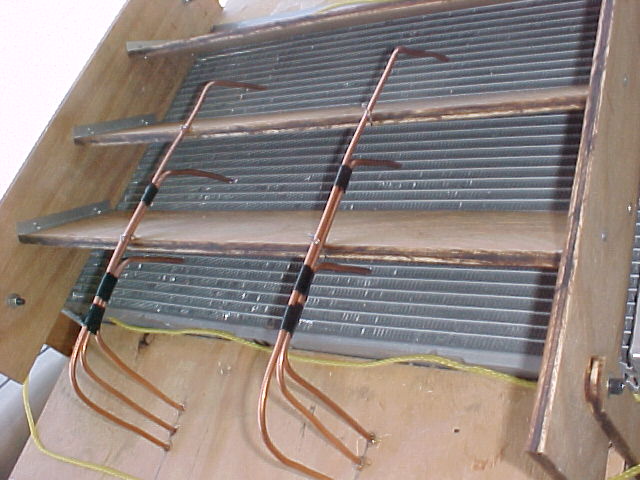
What I did with my full scale test rig is to show how the total
volume of air passing through the rad is affected by the duct shape
both upstream and downstream of the rad core and to measure the velocity of the
air exiting the rad.  This I related to the forward speed of the test vehicle
and not the speed of the air entering the inlet duct as done here. The bottom line.
An important distinction. The closer the speed of the air entering
the cooling system relative to the forward speed of the airplane
the better the cooling potential. You cannot assume that the speed
of the air entering the cooling system is the same as the forward speed
of the airplane. Air can spill out of the intake and flow around
outside the scoop due to higher pressure in the cooling system.

Paul Lamar

The Rotary Engine NewsLetter.  Powered by Linux.
ACRE NL web site. http://home.earthlink.net/~rotaryeng/
Copyright 1998-2004 All world wide rights reserved.