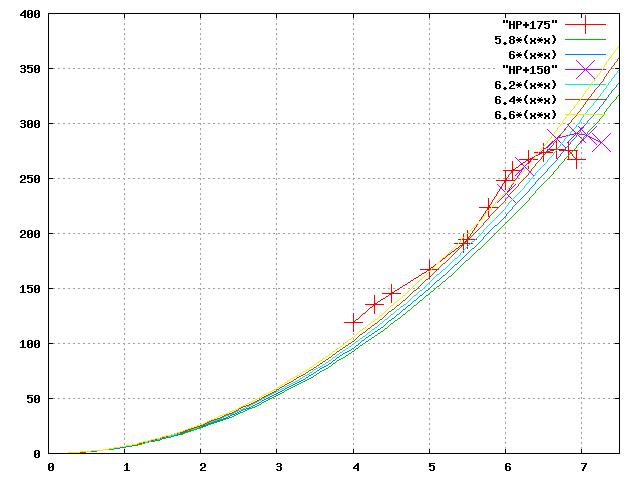
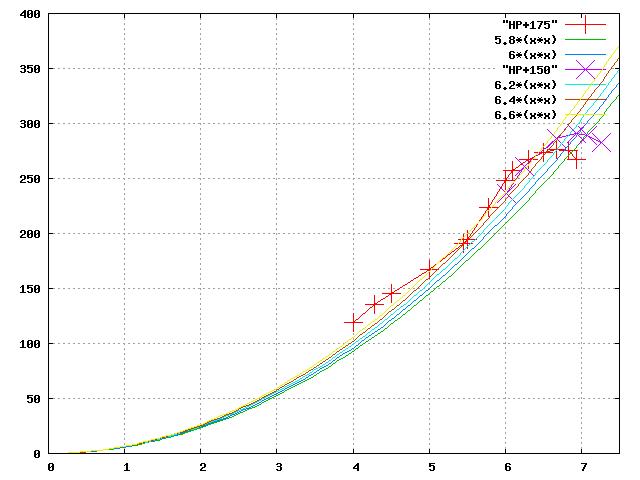
BTW the Lemans engine power curve below 5000 RPM is determined with
the intake tubes fixed in the 175 position so that divided by two is
what we will get in the idle to 5000 RPM range. It would be nice if
this were plotted on your charts along with the prop curves so we
could determine what happens around static RPM.
Hi Paul,

If I understand, this is the same chart plotted to a lower RPM.  If so,
here it is.  I haven't seen any data below 4000 RPM.  I'm also attaching
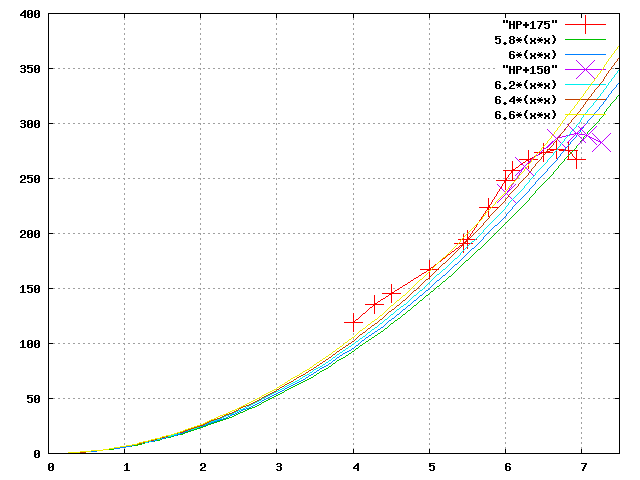
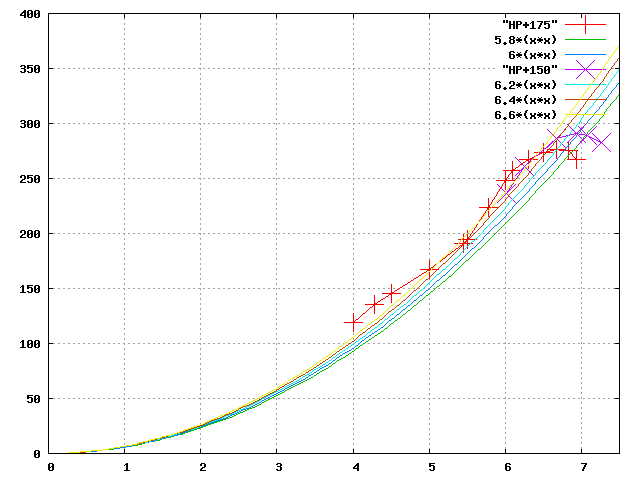
a .png versoion of the plot. Is this format compatible with your
newsletter? As you can see, the file size is much smaller.  If everyone
can open a .png, it would save a lot of bandwidth for the dial-up users.

Bob White

--
http://www.bob-white.com
N93BD - Rotary Powered BD-4 (soon)
You have been a great help on this Bob. Thanks.
I want people to understand the interaction between prop load
and intake manifold tuning and these curves go a long way in
that direction. Thanks again.

Paul Lamar

The Rotary Engine NewsLetter.  Powered by Linux.
ACRE NL web site. http://home.earthlink.net/~rotaryeng/
Copyright 1998-2004 All world wide rights reserved.