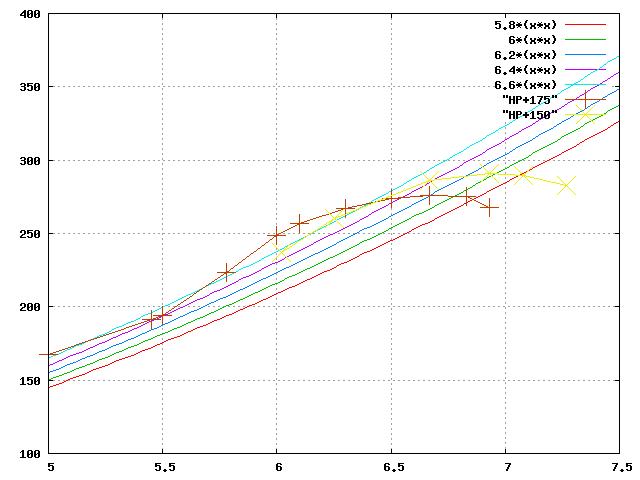
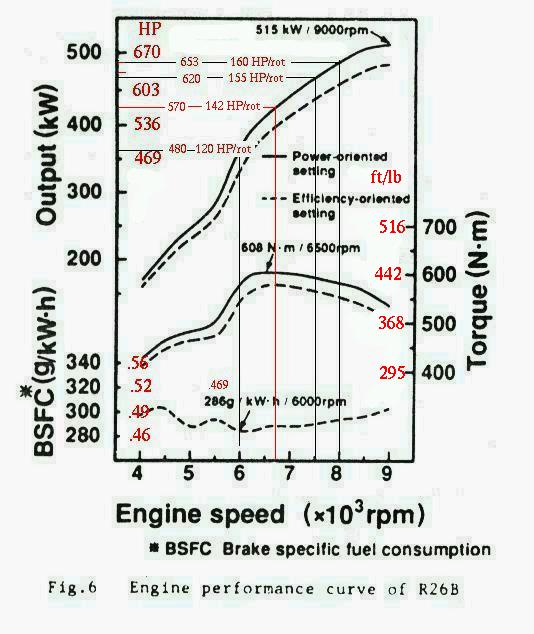
A square law function curve plotted on these charts will show the
effect of prop load. Prop load HP is at least a square law and
maybe as much as a cube law. A series of these curves overlaid on
these charts could represent different prop pitches.

Paul Lamar
Hi Paul,

If you have any idea what formula to use, we can put it on the
charts as well.  Here is an example where I added (arbitrarily)
y=6*x^2 and y=7*x^2 curves as examples.  I also cut the HP in half
so you don't have to.

Bob White

--
http://www.bob-white.com
N93BD - Rotary Powered BD-4 (soon)
Not what I had in mind. You start at zero RPM and zero HP and pick a
number K that when multiplied times RPM squared generates  a HP
consumption curve that intersects the HP peak on these curves. Lets
say K is 0.000005102 or 5.102 times ten to the minus sixth multiplied
by 7000 RPM squared or 49,000,000 will equal 250 HP.

Prop load = K Times RPM squared. Dithering K a bit up and down will
plot a series of closely spaced curves on either side of the HP peak.
these will then represent fixed pitch props with slightly different
pitches.

This is coming in from the back door as we lack HP consumption curves
for most available props.

Perhaps Vance can supply us with actual prop HP consumption curves
as a function of RPM, pitch  and diameter. That will allow us to pick
a prop that will match the HP available from the rotary engine and or
tailor the HP available to suit individual needs.

Paul Lamar

The Rotary Engine NewsLetter.  Powered by Linux.
ACRE NL web site. http://home.earthlink.net/~rotaryeng/
Copyright 1998-2004 All world wide rights reserved.
Hi Paul,

I'm not sure how these plot differs from what you are describing
although it is only by shear concidence as they were only an example.
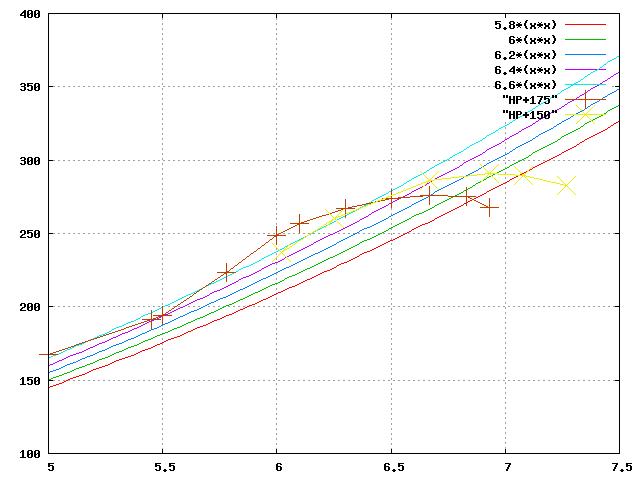
But, the plot at 6*x^2 passes near the peak of the +150 curve and X =
RPM X 1000, so the constant is 6 times 10 to the minus sixth times RPM
squared as you indicated.

Here is a plot with a series of curves near the + 150 peak and a series
near the + 175 peak varying from 5.8 time 10 to the minux sixth thru 6.6
times 10 to the minus sixth.  I shortened the bottom scale so they would
have more separation.

Bob White

--
http://www.bob-white.com
N93BD - Rotary Powered BD-4 (soon)
Excellent Bob. The parallel aspects of these curves with the HP curve blows me away.
If this arbitrary square law prop HP function is correct one can see how small
changes in pitch can make major difference in the max RPM and HP the engine
will generate.

Now we need some real curves from Vance. I suspect the exponent is greater than
2 and will also be a function of what is known as advance ratio. This will
make the prop curves less parallel with the HP curves in this area.

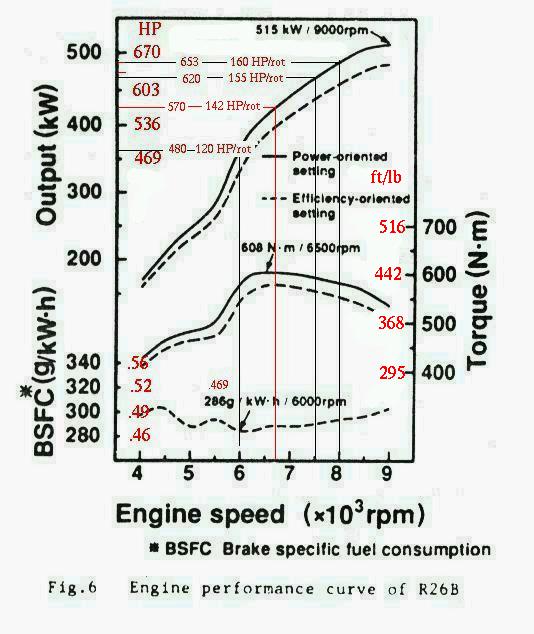
BTW the Lemans engine power curve below 5000 RPM is determined with the intake
tubes fixed in the 175 position so that divided by two is what we will get in the
idle to 5000 RPM range. It would be nice if this were plotted on your charts
along with the prop curves so we could determine what happens around static RPM.

The advance ratio is the ratio between perfect prop screwing motion and the actual
forward motion of the aircraft. Another way of putting it is slippage.

Richard On Mises book "Theory of Flight" has some interesting curves on this
prop HP consumption subject.

We are are converging on a prop selection solution here. Trail and error
fixed pitch prop selection can be very expensive. It is probably cheaper to make
the manifold tunable and take what you get with a given prop.

Paul Lamar

The Rotary Engine NewsLetter.  Powered by Linux.
ACRE NL web site. http://home.earthlink.net/~rotaryeng/
Copyright 1998-2004 All world wide rights reserved.