BTW the Lemans engine power curve below 5000 RPM is determined with
the intake tubes fixed in the 175 position so that divided by two is
what we will get in the idle to 5000 RPM range. It would be nice if
this were plotted on your charts along with the prop curves so we
could determine what happens around static RPM.
Hi Paul,

If I understand, this is the same chart plotted to a lower RPM.  If
so,
here it is. I haven't seen any data below 4000 RPM. I'm also
attaching
a .png versoion of the plot. Is this format compatible with your
newsletter? As you can see, the file size is much smaller.  If
everyone
can open a .png, it would save a lot of bandwidth for the dial-up
users.
Bob White

--
http://www.bob-white.com
N93BD - Rotary Powered BD-4 (soon)
You have been a great help on this Bob. Thanks.
I want people to understand the interaction between prop load
and intake manifold tuning and these curves go a long way in
that direction. Thanks again.

Paul Lamar
Paul

Let me get this straight.  Your data shows, the effect of RPM (at least
for
the P port versions) on the Hp curves and the estimated prop pitch
angles
to allow the engine to achieve those rpms. So with a constant speed
prop to
reach highest rpm according to your data we would be setting the pitch
angle
at 6. Step to the blue line please. I understand this chart is more
for
demonstration the effect. All props would have a different power curve
and
perhaps not so linear.

Muy bueno

Doug in Japan.
These are my wild at guess of the HP consumed by a prop as a function of
the RPM looks like. They arer in no way quantitative at this point. It
could
be some other math function and may in fact not be so simple.
Due to the fact that tips of the prop approach supersonic velocity and
a consequently steep drag rise the shapes of these curves could be far
different.
I am hoping Vance can come up with some prop HP consumption figures based
on
his computer simulations.

Paul Lamar
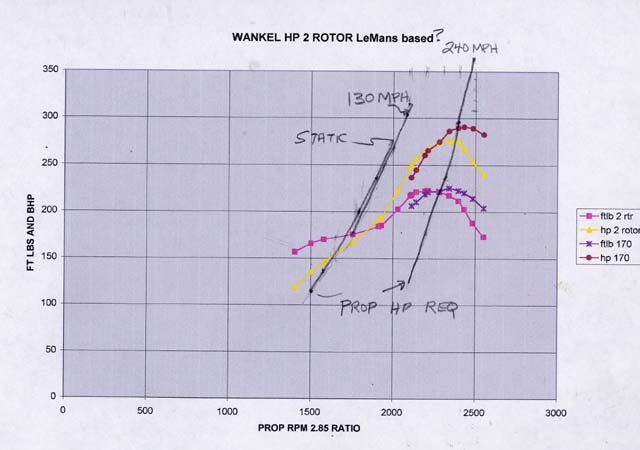
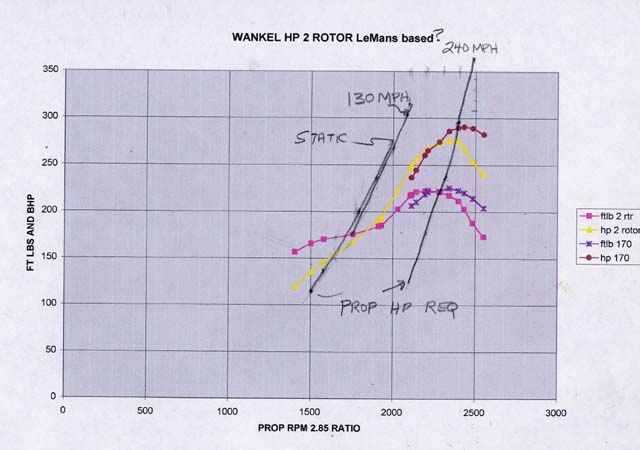
Paul and others - I think this is somwhat like what you are seeking. The HP
and
torque curves are plotted with EXCEL and are against a 2.85 reduction
(torque
is foot lbs at the engine and HP is at the prop. The prop load curves are
for
a simulated 73 in dia with 115 in pitch for a 240 mph plane, blade area is
set to absorb appropriate power at that speed. the static and 130 mph
(climb)
power curves run in a terrible pit of low HP this 2.85 reduction appears
not good on a fast plane static is almost hopelessly stalled and power has
not
really come on for climb. Variable pitch is really needed to make this a
happy
set up. - Vance
We are on to something here Vance.  What does it look like set to
230 MPH and 68 inches?

3 blades perhaps?

What flat plate drag does this work out to?

Great work. Exactly what we are looking for. Thanks.

Paul Lamar

The Rotary Engine NewsLetter.  Powered by Linux.
ACRE NL web site. http://home.earthlink.net/~rotaryeng/
Copyright 1998-2004 All world wide rights reserved.