Paul:
I think most of us have always assumed that Wankels tend to have fuel
consumptions on the order of about .6 lbs/hp hour.
Is fuel consumption on these engines linear (.6 lbs/hp hour x any point
on the hp curve)? Or is fuel consumption more curved (higher in lbs/hp
hr at some points and less on others?)?
As I understand your compound engine work, you are proposing to turn the
Wankels exhaust heat via a mechanically linked turbine into extra work,
thus reducing the effective fuel consumption per hp? Is the Wankel
particularly good in this sense because of its higher exhaust
temperatures, thus providing a higher temperature gradiant to the
turbine or is it a function of exhaust pressures?
How sensitive is fuel consumption to changes in exhaust systems? I get
the impression that inlet runner size and length can be a big deal when
considering PP versus other Wankel layouts. But what about the exhaust
side?
I've been looking at a project using a small Wankel and for the heck of
it have been wondering if it is worth turbo-ing versus going with two
rotors. From a balance and vibration point of view the two rotor seems
easier. From a packaging and fuel consumption point of view, maybe the
turbo makes sense. From reading the enclosures on the board I get the
distinct impression that multi-rotor is much easier to execute and
requires considerably less development and cost. The charge-cooled
Wankels seem to have a small disadvantage in terms of fuel consumption
due to charge pre-heating. If any of them catch on it would seem to me
that they would show even higher improvement in fuel consumption with
your compound approach.
George W
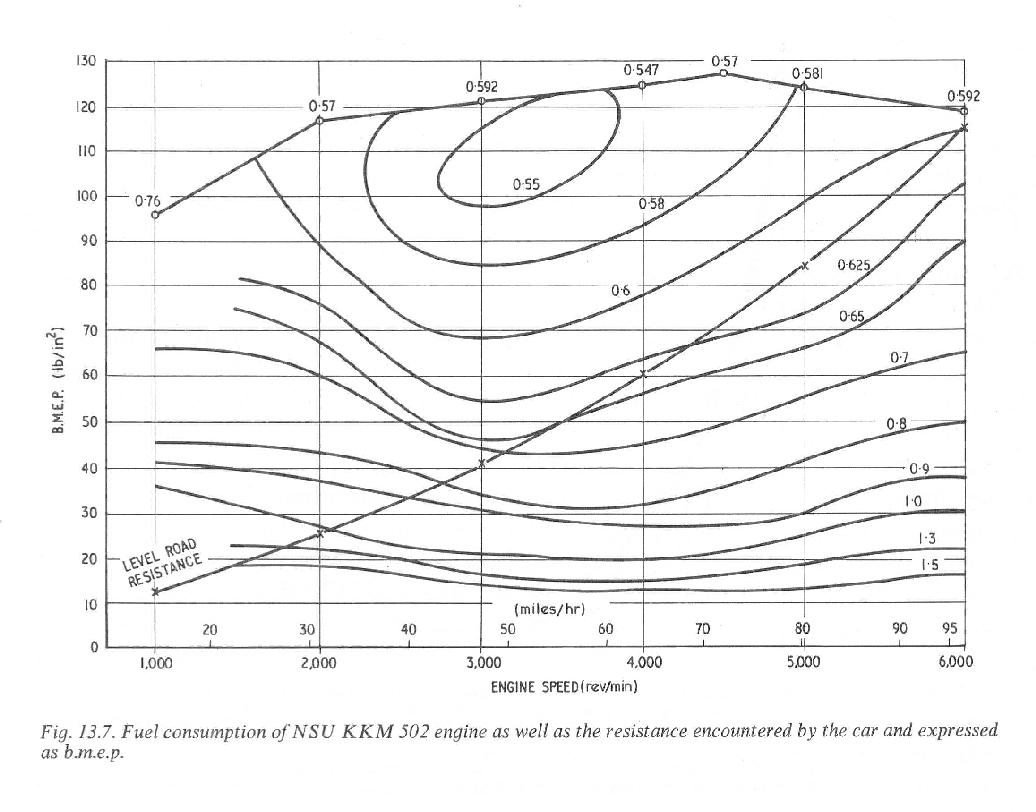
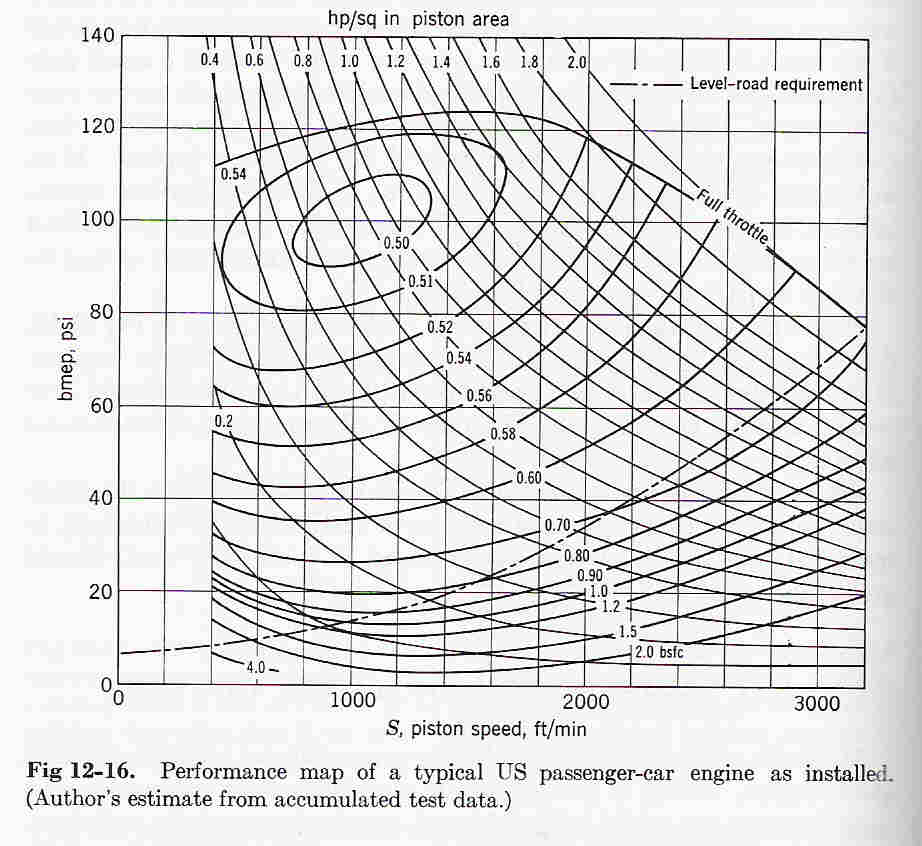
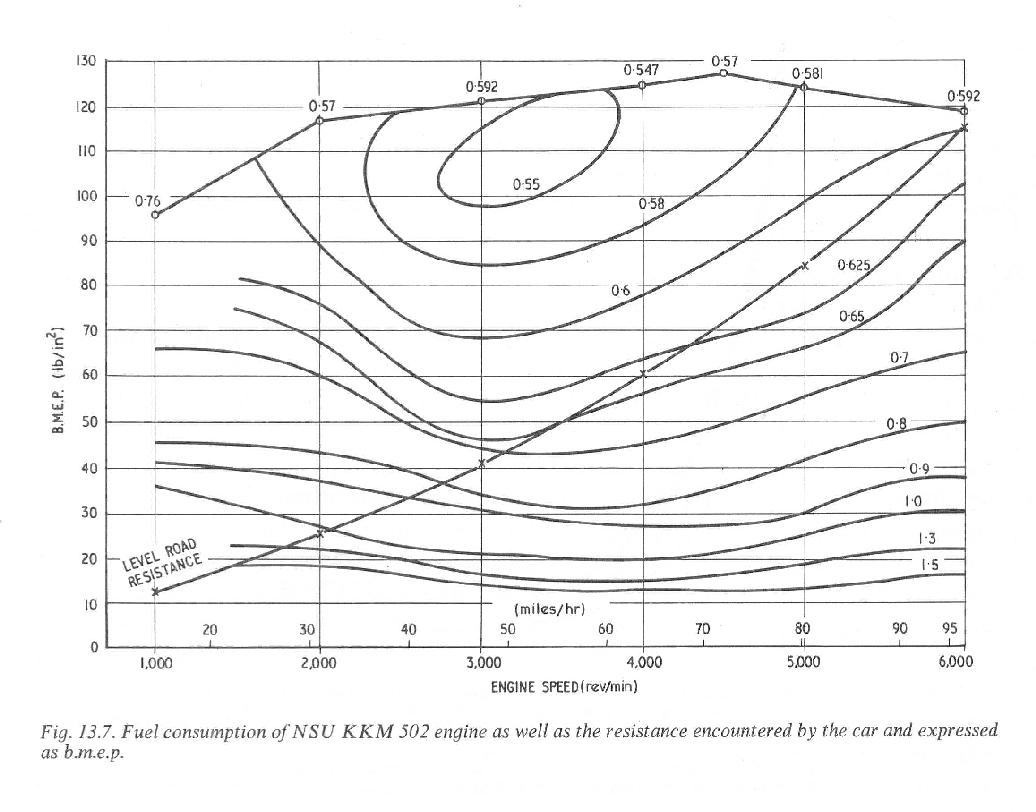
There is a BSFC map for all internal combustion engines
as a function of load and RPM.
This is a classic map for a NSU KKM 502 engine from Ansdale's
book. BMEP is equivalent to torque. Sort of. What is stands
for is Brake Mean Effective Pressure. Later NSU engines were
Better getting down to 0.5 BSFC.
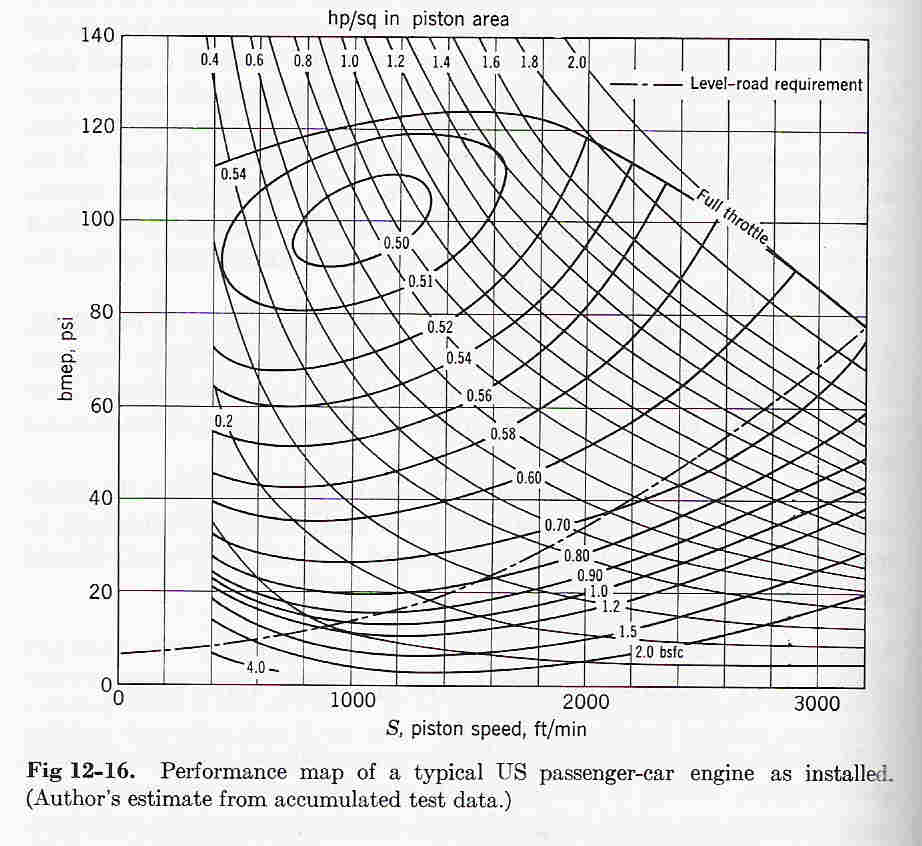
Chart 2 is from Taylor and it is for a typical US car engine
from a few years ago. Probably around the same time as the
NSU chart.
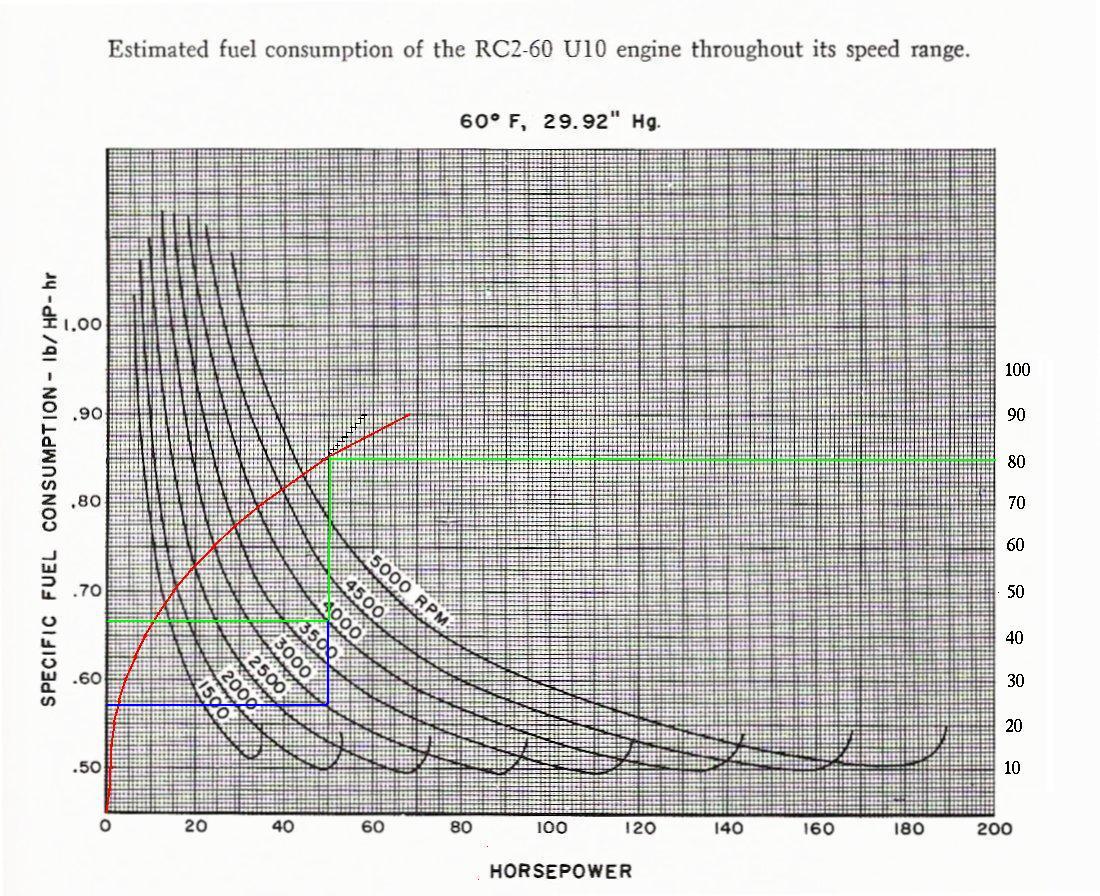
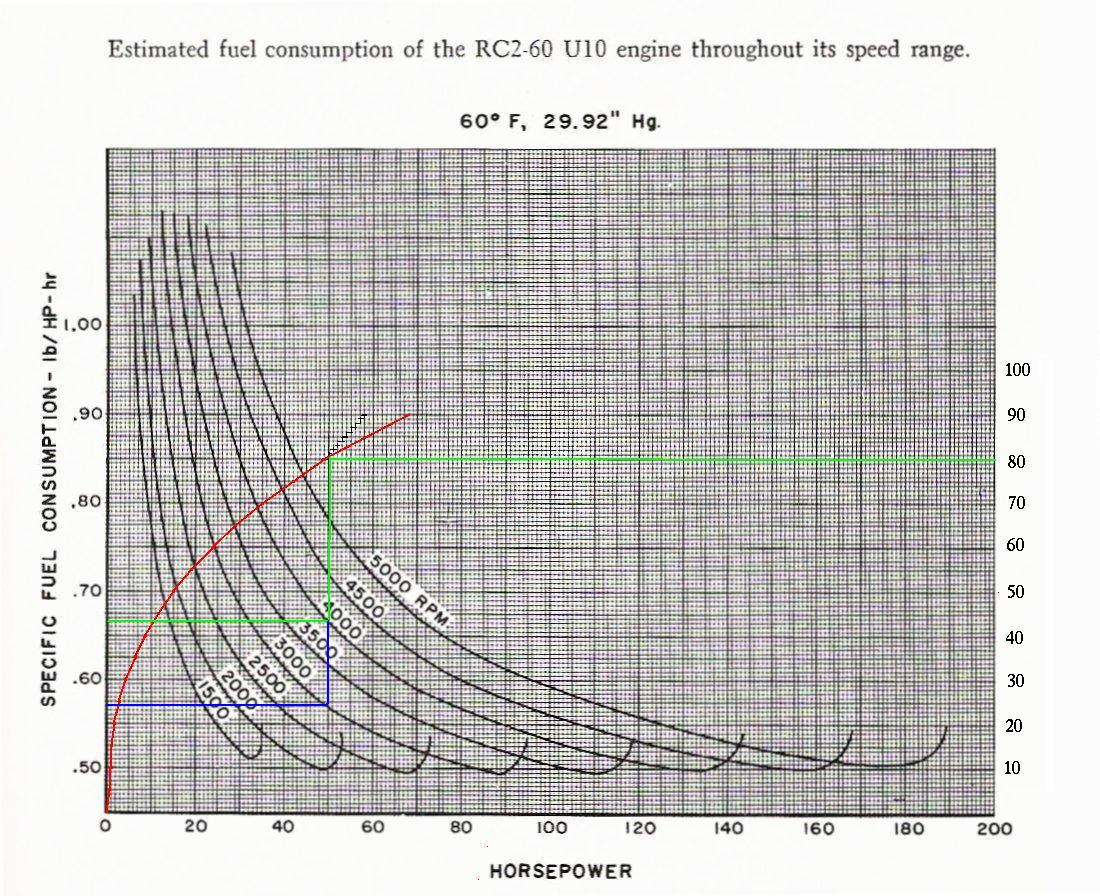
There are other ways of graphing BSFC. Here is an example
from Curtis Wright. Chart 3. Take it with a grain of salt
as it is estimated and not measured. The red line is an
estimated road load for a car that I added.
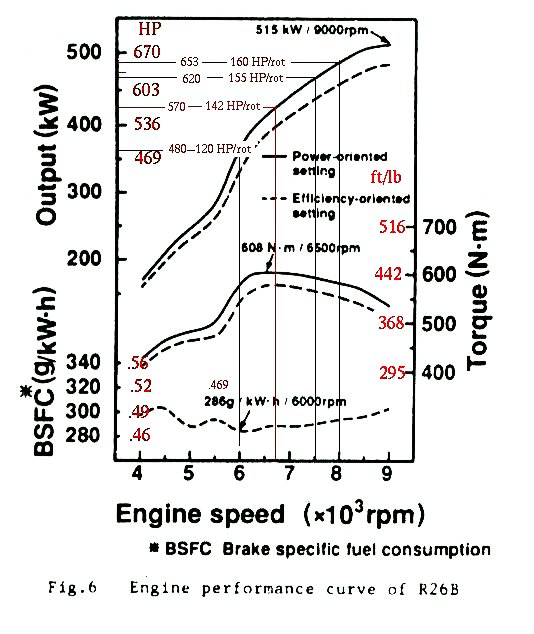
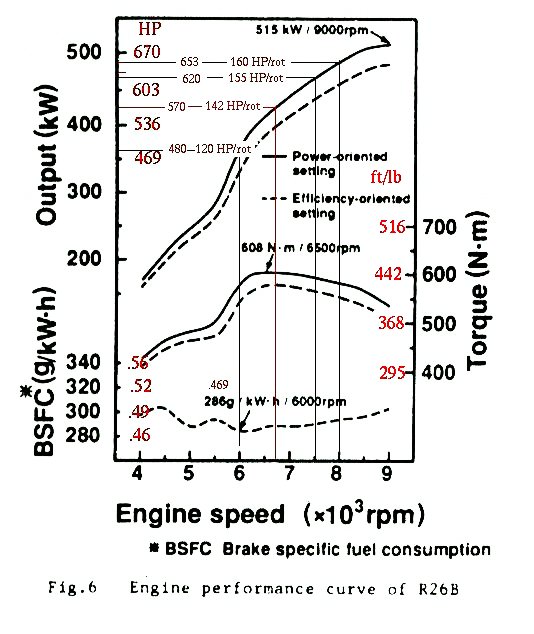
The 4th chart you have seen many times and it plots
BSFC only at WOT for a range of RPM's. Probably state of
the art for Wankel engines. The Mazda Lemans engine.
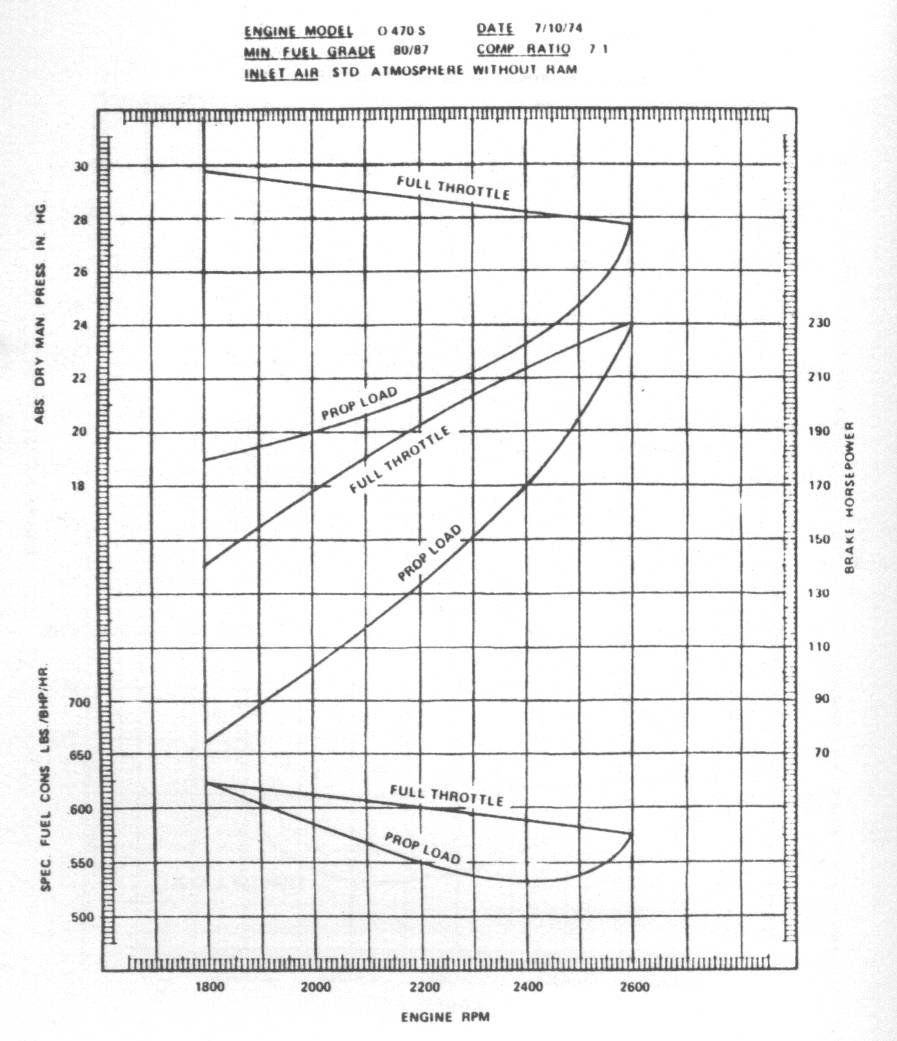
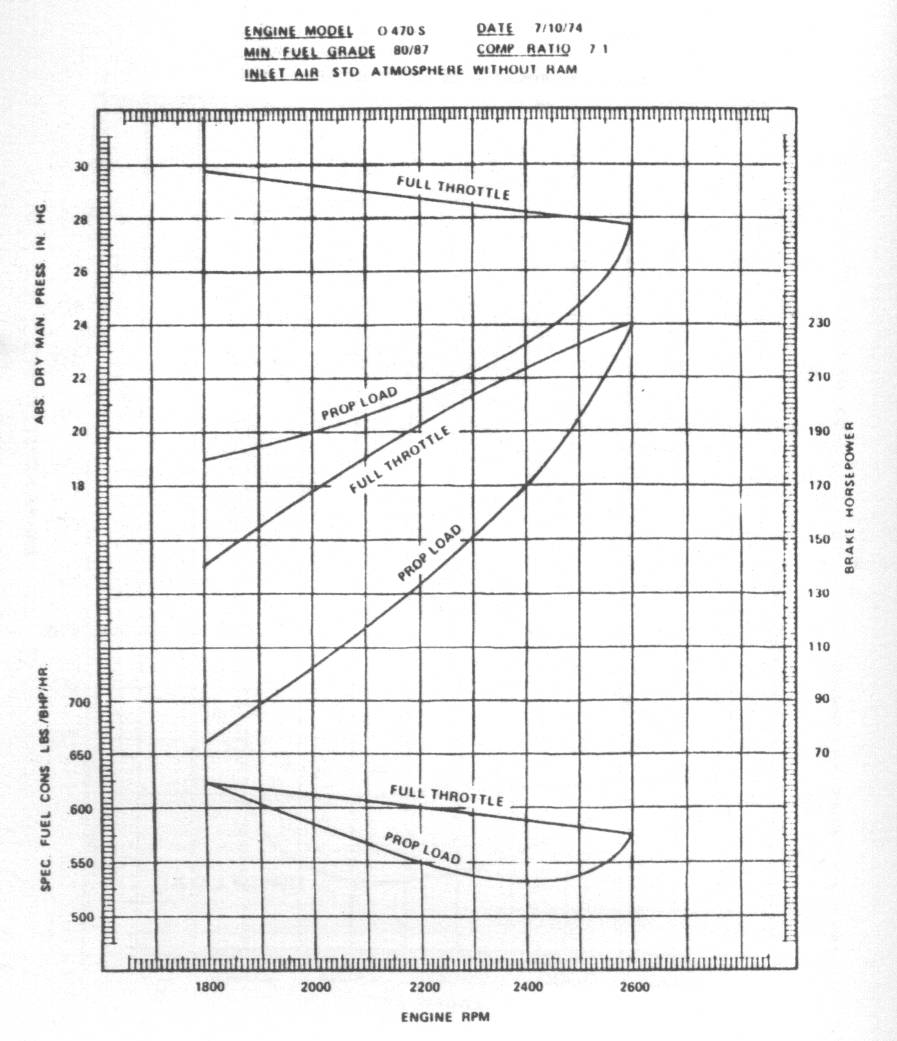
The least chart is for the popular O-470 engine found
in the Cessna 182. In any aero engine the only thing
that counts is what the BSFC is at prop load.
The Rotary Engine NewsLetter. Powered by Linux.
ACRE NL web site.
http://www.rotaryeng.net
Copyright 1998-2006 All world wide rights reserved.