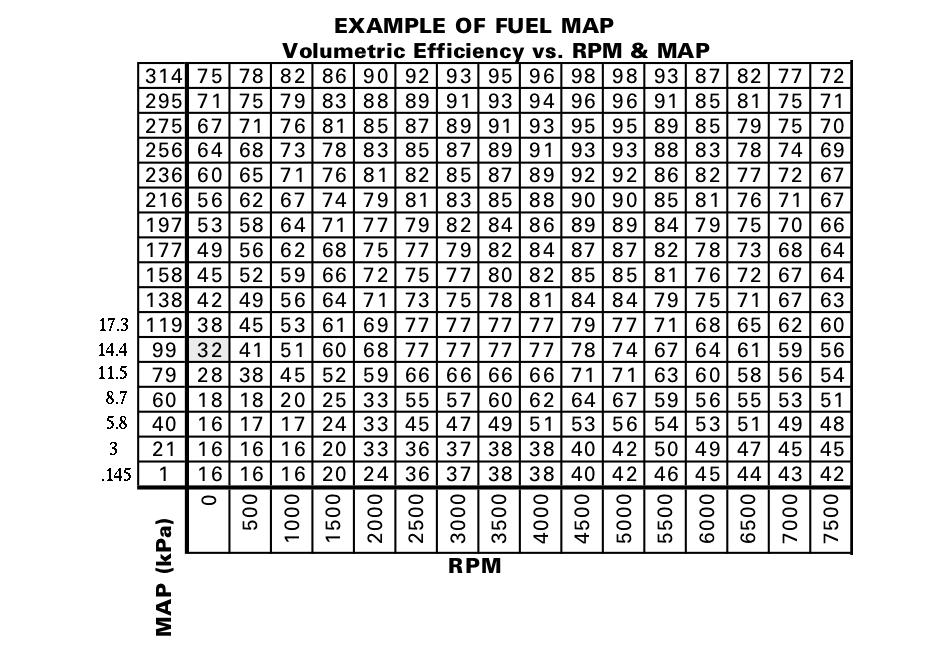
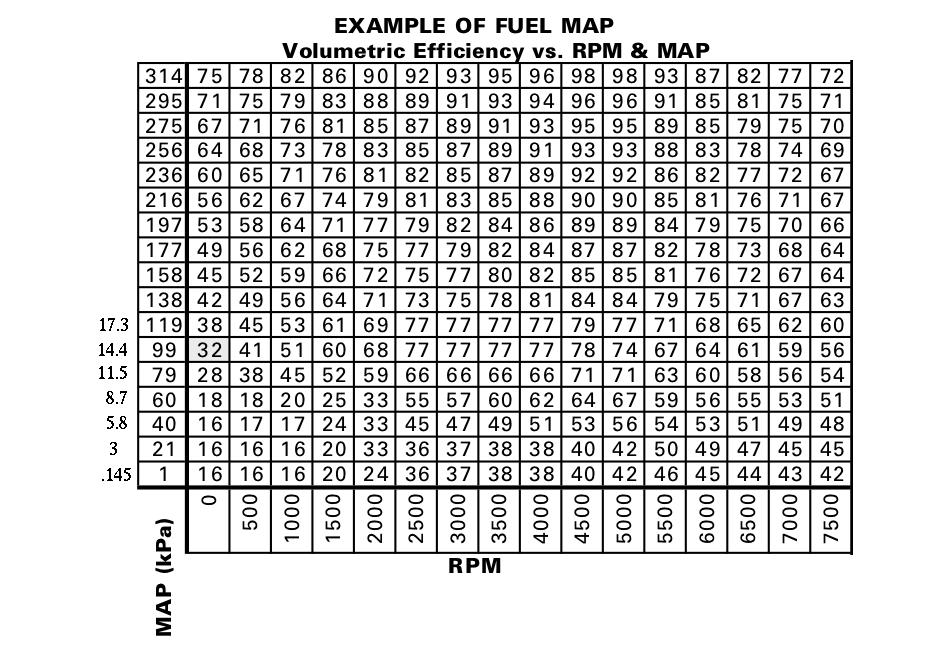
Speaking of Kinsler charts here is one I got out of
page 70 of the pdf catalog.
It is a fuel map from an EFI system. I think we can use it
to estimate what happens if the throttle is slammed open
on our new simple mechanical fuel injection.
The Kpascal scale is suspect as I converted a few to psi.
This map looks like a double A fuel dragster with about
3 atmos of boost. I kind of doubt it but we will assume for
the moment it is valid.
Lets say we are on approach at 3000 RPM and 8.7 psi of absolute
manifold pressure and we slam the throttle open on our new mechanical FI.
The fuel will temporarily jump from about 57 to 77 or a 1.35% increase.
The numbers by them selves don't mean much except they are proportional
to the amount of fuel injected. It is the percentage change we are
after. If the engine was running at 15:1 to one the mixture ratio should jump
to about 11:1. The engine RPM will start to rapidly increase tending
to bring the mixture back down. This is a wild ass guess based on a lot of
probably unfounded assumptions but something like this will happen.
This is what we want it to do and this is what happens when
a carburetor accelerator pump is activated. If this is too much fuel and the
engine stumbles because of it we can delay the fuel increase by
restricting the vacuum line going to the back block vac chamber
allowing the engine RPM to increase smoothly.
Paul Lamar ...No rotor no motor.
The Rotary Engine NewsLetter. Powered by Linux.
ACRE NL web site.
http://www.rotaryeng.net
Copyright 1998-2006 All world wide rights reserved.