This from the Rocky Mountain Institute graphically displays shows oil
imports from 1973 to present, in both barrels and $$s spent.
http://move.rmi.org/files/oilmap/RMI_Oil_Imports_Final_large.html
Andy Hecker
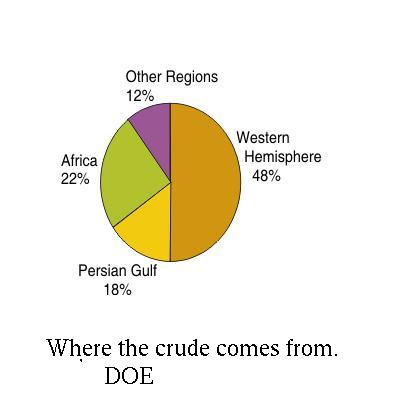
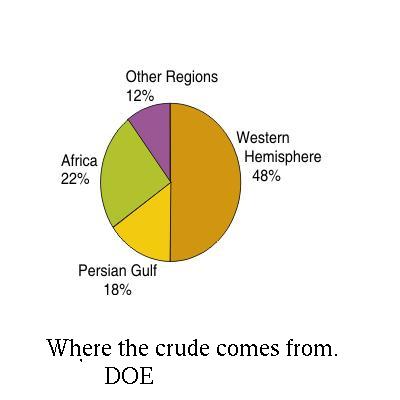
Good work Andy. What it does not show is the U.S. is the worlds
3rd largest producer of crude so it gives somewhat of a false
impression. The attached pie chart reflects that fact.
What we have seen recently is an obvious manipulation of the
price of crude. Approval for drilling off shore and in Anwar
would tend to dampen speculation IMHO.
Paul Lamar
--
The Rotary Engine NewsLetter. Powered by Linux.
ACRE NL web site.
http://www.rotaryeng.net
Youtube key word UTUBPLEASE
Copyright 1998-2008 All world wide rights reserved.