Hi Paul-
I took some time to massage the data from the final run. I added a column
averaging the two rotor pressures, I added a column which identifies the
time of the most recent CAS pulse, and I computed last known RPM.
Mark
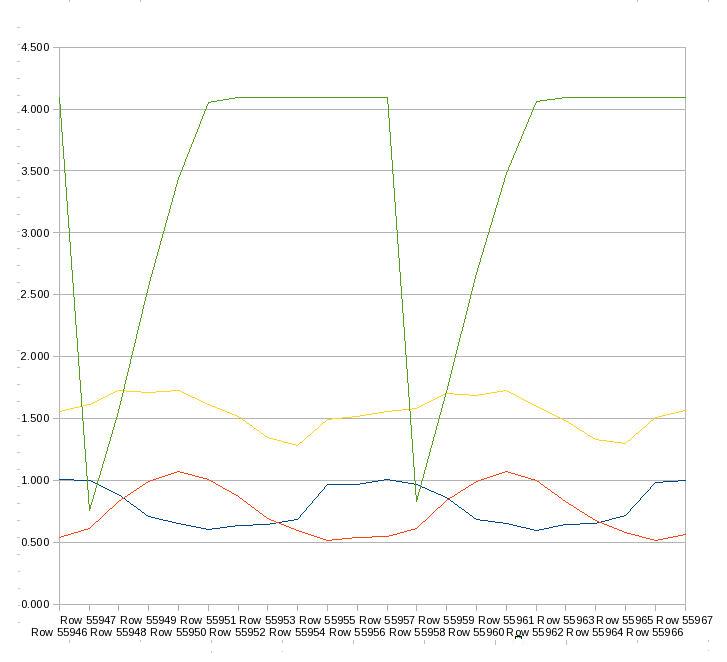
Mark sent the whole 9.2 megabyte spread sheet so I cut just the relevant
stuff and plotted it. 9.2 megs is too big to publish.
The difference in the amplitude of the front and rear rotor waves is
somewhat of
a mystery at the moment. It could be the way the pressure tap hole was
machined
in the runner tube. They were hand drilled. If it is not perpendicular you
could get some strange effects.
This RPM is roughly where the tubes were tuned for so you can see the
pressure
waves peaks happen around bottom dead center and front (car blue) and rear
(red)
rotors are roughly in phase and they add. Mark averaged them (yellow
line).
The green line is the CAS signal.
Mark, please redo do it and just add the rotor pressures together.
That will give us a better idea of how much total air the engine is
getting.
Do not divide by two.
The result should be well over 1.5 volts and well over atmospheric
pressure.
Atmospheric pressure is 1.8 volts at sea level and Mark's air port is
6800 feet. At 6600 RPM the prop tips were near supersonic so that
was the max static RPM of this engine at what ever power it could
make at 6600 RPM and 6800 feet. Once the airplane picks up speed the
engine RPM will increase and so too will the engine HP.
BTW we are at the response limit of the pressure sensors. These are the
same type Tracy is using. The data acq could sample data tens times as
fast
but for the fact the pressure sensors are not up to it.
Right now the engine is under propped. Mark will rerun some of the data
when he gets the right prop on there. Never the less we had to
weigh the tail down with a steel beam to keep the airplane from
nosing over.
Paul Lamar
Hi Paul-
Do you want me to create the same additional fields (pressure1+pressure2;
rpm, etc) on any of the earlier data runs?
mrs
Would not hurt if you have the time.
Paul Lamar
Here's file 11.
All data prior to junk11 does not have the CAS pulses in it. Doesn't seem
like there is a lot of point in massaging it when I won't be able to derive
RPM.
mrs
You are right. You will need some more data when you get the final prop
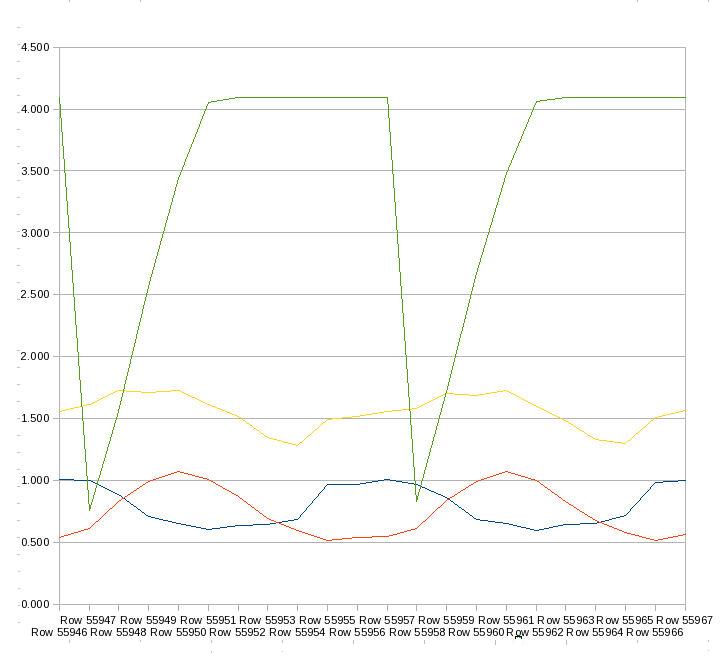
anyway. Here is a plot of 11 with the two pressure curves added together.
Paul Lamar
--
The Rotary Engine NewsLetter. Powered by Linux.
ACRE NL web site.
http://www.rotaryeng.net
Youtube key word UTUBPLEASE
Copyright 1998-2008 All world wide rights reserved.