Paul,
Do you have any graphs of dynamometer testing that show torque, EGT and fuel
consumption vs. manifold pressure at constant RPM--6000 RPM, for example?
Steve Brazil
I wish.
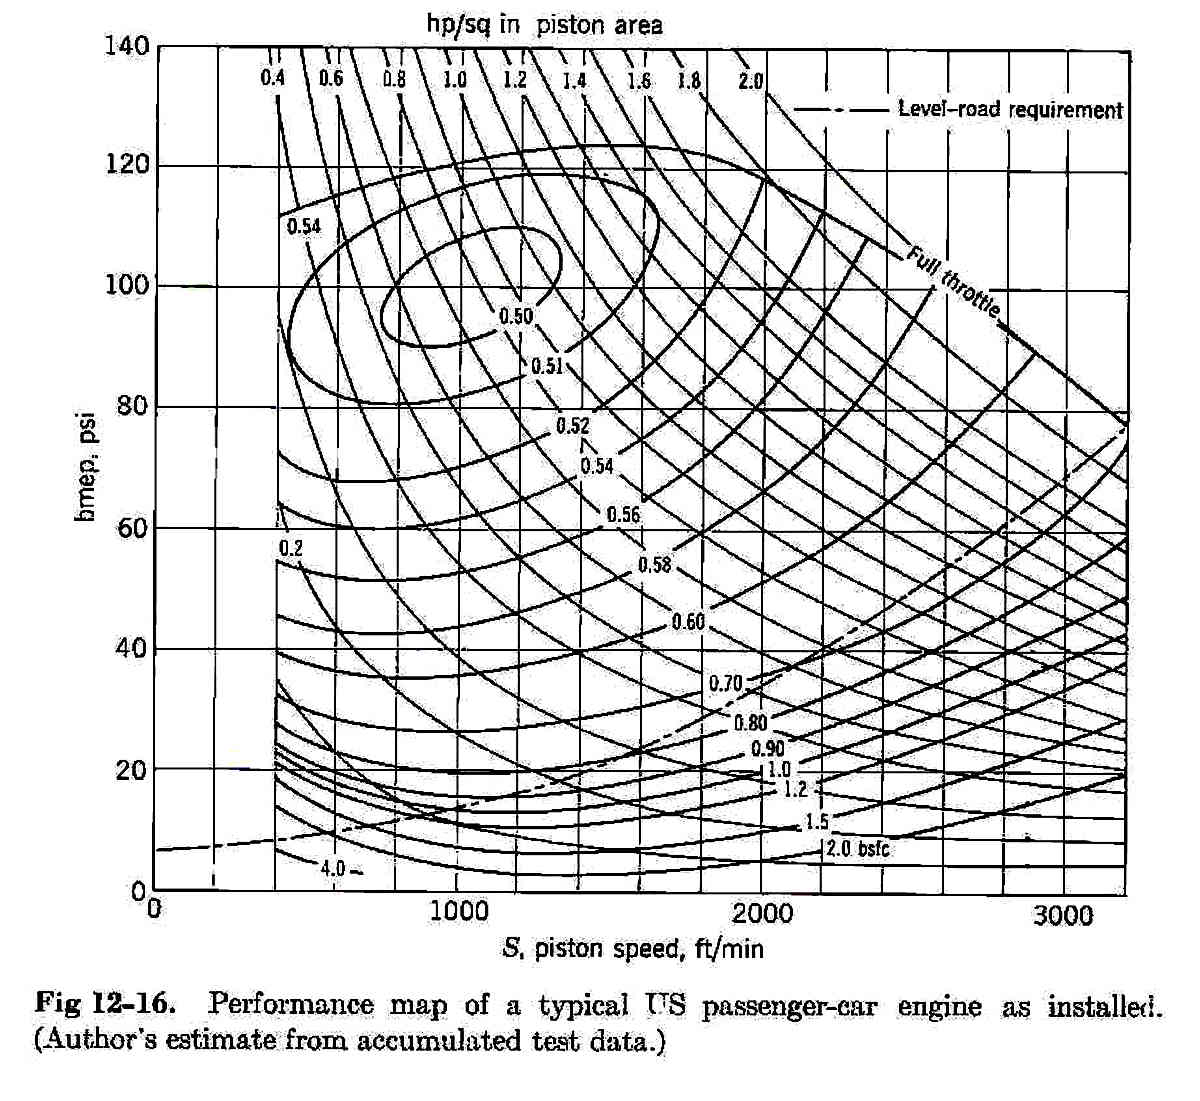
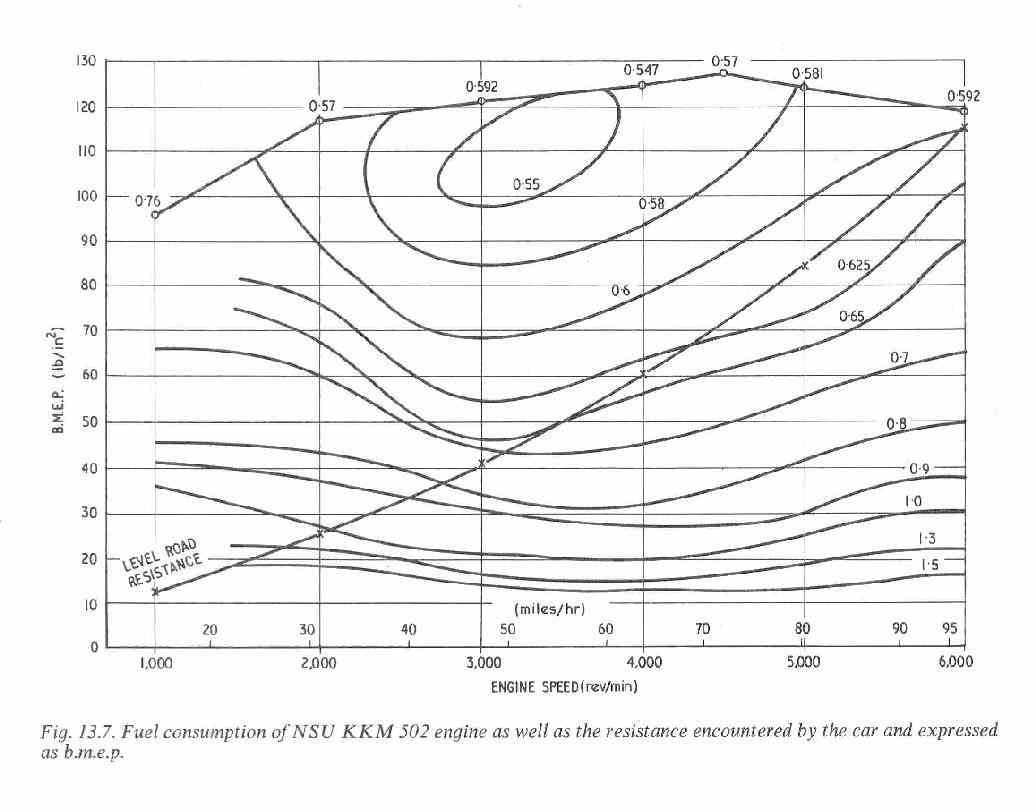
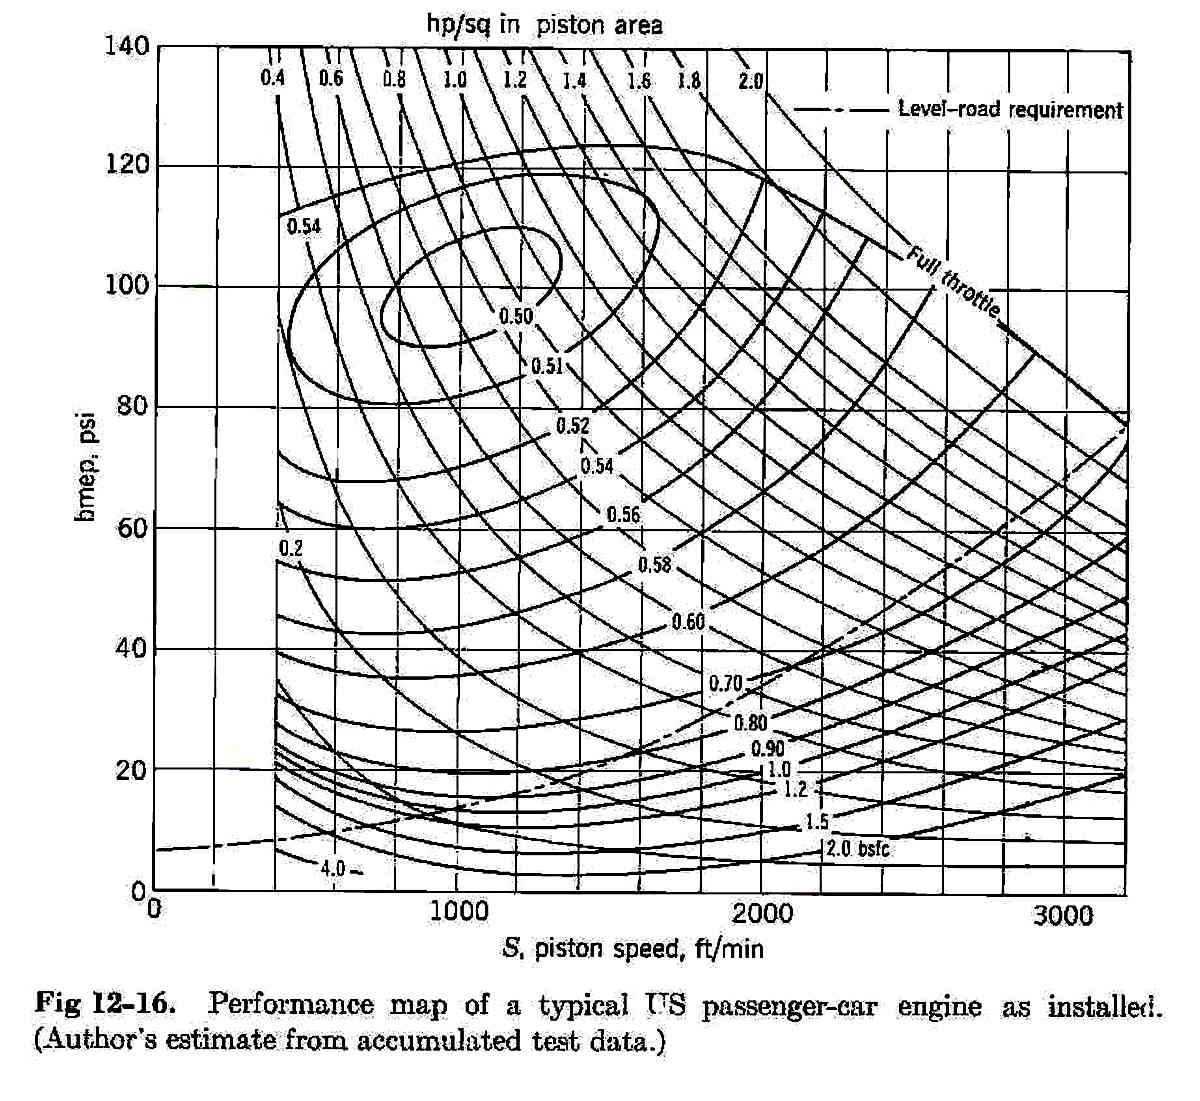
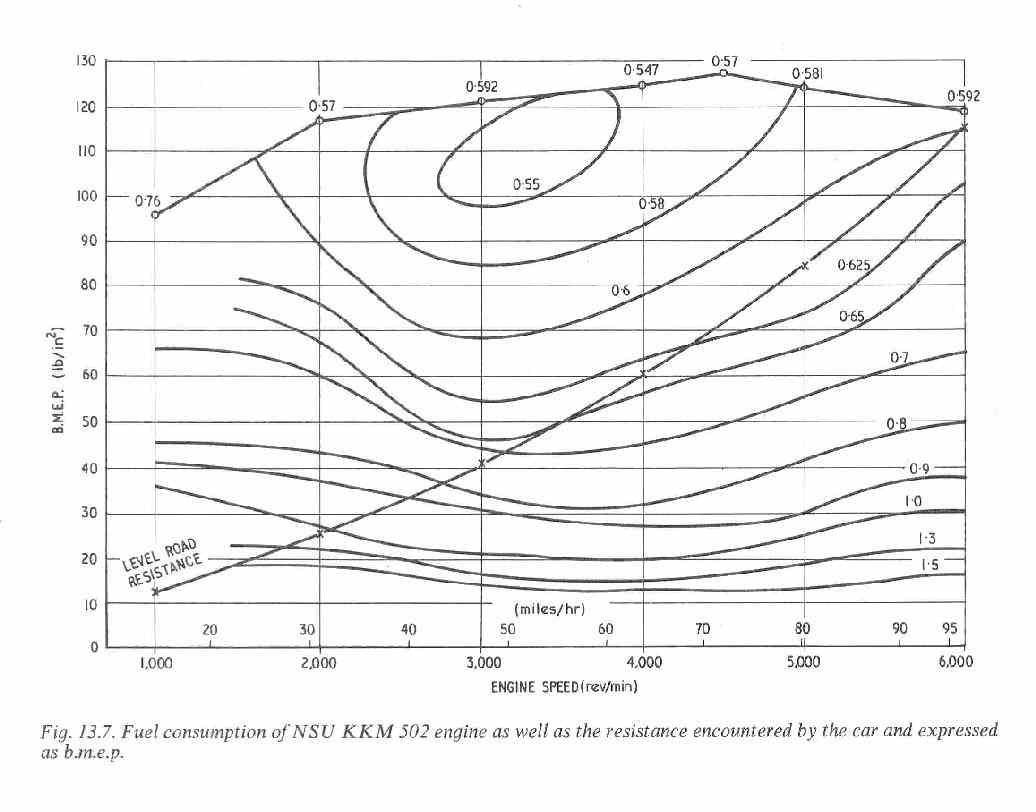
What you are asking for is a BSFC map for the Mazda and they are few and far between. I don't have one. Here is an early
one for an NSU and a typical piston engine. It is difficult data to compile as the engine must be run for a long time at
any one setting due to the difficulty of measuring the fuel flow.
Paul Lamar
The Rotary Engine News Letter. Powered by Linux.
ACRE NL web site.
http://www.rotaryeng.net
You Tube
http://tinyurl.com/beqqxas
Copyright 1998-2013 All world wide rights reserved.